Planned Impact
When planning marketing activities, you may have tangible results in mind. However, it is not easy to demonstrate the connection between these expected results and potential revenue generation and, therefore challenging to justify the required investment. Impact modeling allows you to project expected revenue from marketing activities based on your demand-generation goals. This process is essential in maturing marketing teams from being spend-oriented to result-driven.
To find out which revenue your marketing activities will generate, you can provide performance plan data as a first guide, for example, number of inquiries that should be generated by an activity. Your system administrator also maintains conversion rates, velocity and average deal sizes for your company's sales & marketing funnel. Based on this information, Uptempo calculates when the activity should generate what revenue.
Within the activity hierarchy, the plan performance data should only be entered for activities on the same level. Note that the data can be entered only once in a path.
Tip
We recommend to enter plan performance data as far away as possible from the root element.
A roll-up is displayed for ancestor activities. The roll-ups includes blended numbers for inquiries, velocities and deal-sizes in case exceptions are used for impact calculations.
No information about the planned performance can be given for descendants.
Plan performance data can be entered in the Details panel on the Impact tab.
Note
The specification of attributes can have an influence on the calculation of the performance plan data. We therefore recommend that you first edit all attributes of the activity on the Details tab. Only then calculate the performance plan data.
The following screenshot shows the default Impact tab:
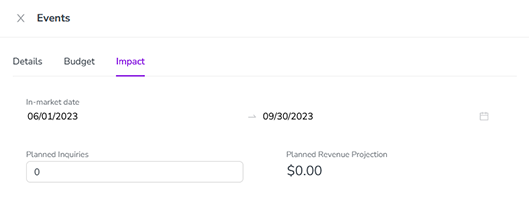
When you enter a number in the Planned Inquiries attribute, the system calculates the plan performance data based on the funnel information:
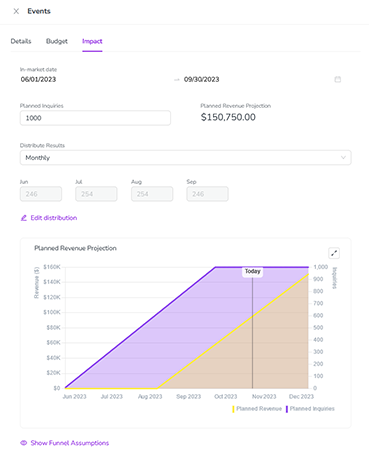
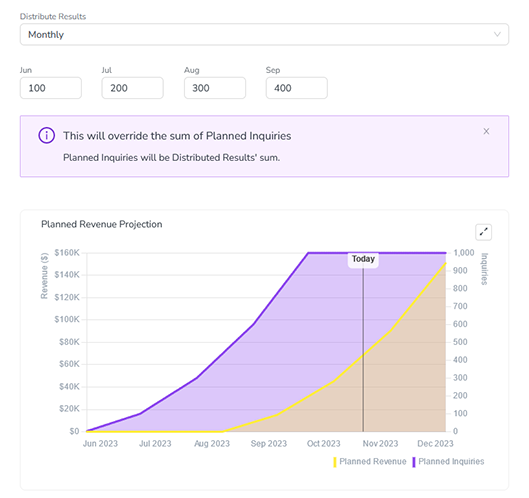
It is assumed that the planned inquiries are generated within the in-market dates. The system uses the funnel definition to calculate the planned revenue. Initially, a linear distribution over the in-market dates is assumed. However, you may know that, for example, fewer inquiries are generated at the beginning and more at the end. Since this influences when which renevue is generated, you can adjust the distribution. To do this, select Monthly or Quarterly in the Distribute Results dropdown and then click Edit Distribution. This opens the according time range fields:
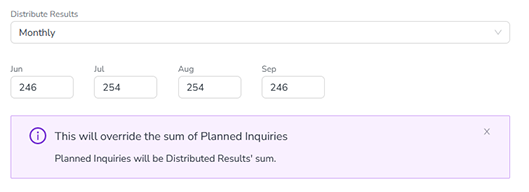
Choose whether you want to enter the distribution monthly or for the quarters. Then enter the numbers in the month or quarter fields. The sum of the numbers will overwrite the Planned Inquiries field. The Planned Revenue Projection diagram will automatically be updated. The following screenshot shows an uneven and increasing number of inquiries each month:
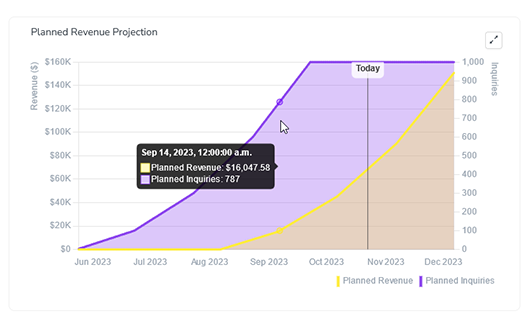
When hovering over the projection chart, a tooltip is displayed showing the planned revenue and planned inquiries for the respective date.
Clicking  expands the chart.
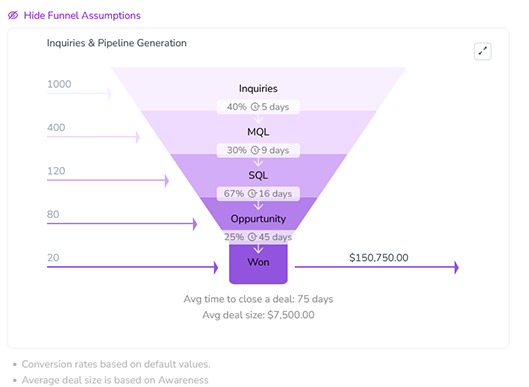
If you want to know with which data the funnel is defined, for example conversion rates or average deal size, click Show Funnel Assumptions. This will additionally show the funnel defined for this activitiy: