Tracking Spend
While viewing the Details panel of any activity, you can track the spend data of connected investments on the Budget tab. Spend data is broken down into subsections for each of the spend data categories defined in the applicable budget hierarchy, e.g. Planned, Expected, Committed, and Actual. Additionally, there is a separate subsection for Estimated Costs:
![]()
Note
When you view the Details > Budget tab for an activity that is connected to an investment, you'll only see subsections for the spend data categories that are configured for the investment's budget hierarchy.
Spend data category subsections are hidden automatically if they are not relevant to an activity, or if the activity is not connected to an investment.
Each subsection on the Budget tab displays the sum total of all connected investment amounts for the corresponding spend data category.
You can click on each subsection expand it and see the following additional details:
-
Funding Source: Information about all connected investments, including name and budget hierarchy position.
-
Activity Roll-Up: The sum of all investment amounts connected to child activities of the activity you're viewing.
-
Spend at current level: The remainder of the total connected investment amount after subtracting the Activity Roll-Up amount.
Note:
If the activity you are viewing does not have child activities, or if none of the child activities are connected to spend amounts themselves, then Activity Roll-Up will not display an amount.
Both activities and investments can exist within a multi-level hierarchy, and you can make connections between them at multiple levels. As you look at different levels of your activity hierarchy, the Activity Roll-Up and spend at current level amounts allow you easily see spending at lower levels, and how this affects funding at the level you're currently viewing.
For example, say you connect an activity representing a Demand Gen campaign to a budget category intended to fund that campaign. The budget category contains line items totaling $15,000, so at the beginning, you know that you have $15,000 to fund tactics within the campaign.
As you plan out the campaign further, you can create child activities under the campaign activity for each of the tactics. As you create the tactic activities, you can connect them to specific line items within the budget category to track how much of the overall campaign budget each tactic is consuming, e.g. Tactic A is $7,000, and Tactic B is $3,000.
At this point, the Details > Budget tab for the Demand Gen campaign activity would look like this:
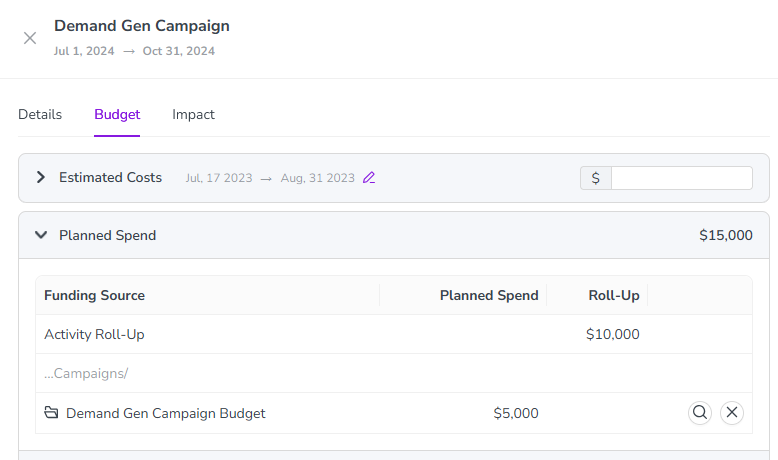
In this view, you can see at a glance that:
-
The total planned spend for this campaign is $15,000 (the total amount available in the connected Demand Gen Campaign Budget investment).
-
The portion of the investment that is already consumed by child activities of the Demand Gen Campaign activity is $10,000 (the amount shown on the Activity Roll-Up row, i.e. $7,000 for Tactic A + $3,000 for Tactic B).
-
The portion of the investment that remains available for the Demand Gen Campaign is $5,000 (the amount shown on the Demand Gen Campaign Budget row, i.e. $15,000 total - $10,000 Activity Roll-Up).
This breakdown allows you to quickly understand exactly how much has been spent, and how much remains available to fund other tactics (or reassign elsewhere), when looking at any level of your activity hierarchy.
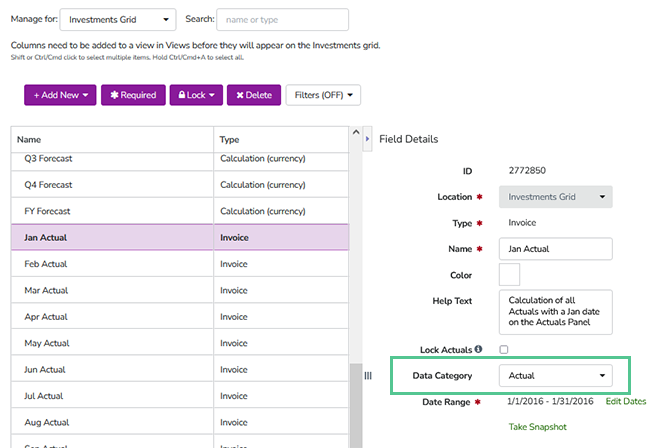
To activate the correct display of the spend data, click Budget in the main navigation and then > Master Settings / Custom Settings. On the Columns page, select the fields you want to display for activities. Activate the corresponding statuses in the Spend Data Category field.
Note
Investments are managed in monthly values, but you will be shown a total annual value for activities. The system automatically calculates the total annual value from all columns marked with the corresponding category.
You should therefore review all monthly columns for plan, forecast (expected), and actual data to ensure that you have defined the correct annual value for activities.
In case you don't activate the display of the different spend categories, then the sections on the activities' Budget tabs will always show an amount of 0.