Analyze the Performance of an Activity
To find out how an activity performs you analyze the data on the Impact tab of the Details panel. As soon as actual performance data is entered the following elements show the performance for an activity:
As Marketing Ops you want to recognize early on whether an activity is a flop and you should change course or increase efforts. Therefore, you need to understand how the activity performs compared to your plan. To do so, open the Details panel. Switch to the Impact tab and click the Actual sub-tab. On the top of the sub-tab, the following data is shown:
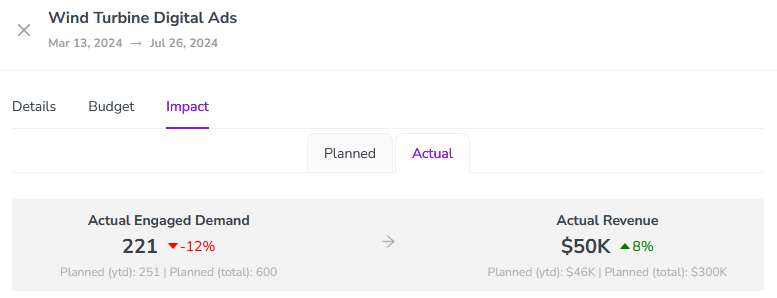
The left number shows the total actual impact of the activity and compares it to the total planned year-to-date (ytd) impact. The percentage shows the result of the comparison. In the example above, the actual impact is 12 % lower than the planned impact.
The number on the right shows the total actual revenue and compares it to the total planned year-to-date revenue. The percentage shows the result of the comparison. In the screenshot above, actual revenue is 8 % higher than planned.
The Impact Projection diagram shows the development of planned vs. actual impact and planned vs. actual revenue as soon as actual data is tracked. To display the diagram, open the Details panel and switch to the Impact tab. The diagram is shown on the Planned sub-tab:
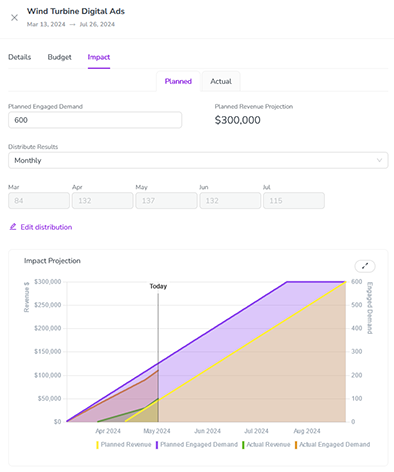
To get a more detailed overview, click the  icon to expand the chart. The diagram is opened in an overlay:
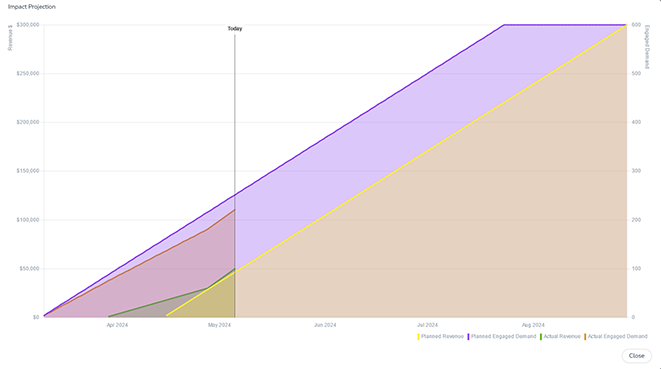
You can hide individual KPIs to restrict the view to specific facts or to make details visible. Click on the respective name below the diagram to hide or show the KPI again.
Click Close to return to the activity's Detail panel.