Configure Your Impact Modeler Funnel
To use Impact Modeler, you must set up your demand funnel. The setup process consists of the following steps:
-
Set up funnel stages: Define the stages of your funnel.
-
Set default performance metrics: Specify the average conversion rate and velocity between each stage, and the average deal size, to use for revenue projections.
-
Configure per-stage revenue tracking (optional): Choose if you want to track projected revenue at stages of the funnel other than the last stage.
-
Set scenario-specific performance metrics (optional): Specify custom conversion rates, velocities, and deal sizes to use for particular scenarios.
Tip
In any model, the quality of the model's outputs is directly determined by the quality of the inputs. In the case of Impact Modeler, the more accurate your performance metrics are, the more accurate Impact Modeler's revenue projections will be.
For best results, analyze historical performance data about your deals before you begin setting up Impact Modeler. To get started, try to use the data to answer these questions:
-
What percentage of leads is lost at each step of the funnel, and how does this vary based on factors such as region, business size, or product type?
-
How long does a lead typically spend in each stage, and is it fairly consistent, or is it a wide range?
-
What are your typical deal sizes, and can you segment them in a meaningful way?
Being able to answer questions like these will give you a good starting point for getting useful results with Impact Modeler. And even if you aren't 100% confident in your numbers initially, you can always keep analyzing the data to refine and improve the model as you learn more.
Before You Begin
To follow the instructions in this section:
-
You must have administrator access to your Uptempo instance.
-
You must have the necessary administrator permissions to access Activity Configuration.
Access Impact Modeler Settings
You can configure all settings related to the Impact Modeler funnel from the Impact Modeler Setup page in Activity Configuration.
To access the Impact Modeler settings page, follow these steps:
-
In Uptempo, click Activities in the sidebar to view the activity hierarchy.
-
Click
 Settings.
The Activity Configuration page opens.
-
In the Activity Configuration menu, click Measures > Impact Modeler.
The Impact Modeler Setup page is shown.
Set up Funnel Stages
The first step in configuring the Impact Modeler funnel is to set up the stages of the funnel. By default, the funnel starts with only two stages: Source and Won.
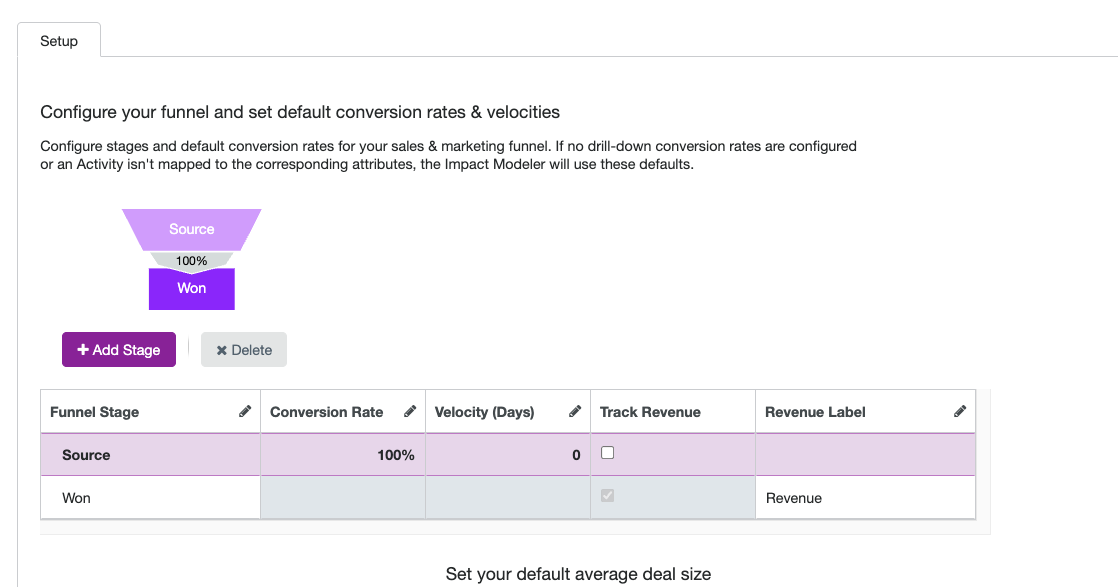
You can add as many additional stages in between as you need, and name them however you like. Funnels commonly consist of five stages, for example:
-
Inquiries
-
Marketing Qualified Lead (MQL)
-
Sales Qualified Lead (SQL)
-
Opportunity
-
Closed Won
The exact number of stages (and their names) that you set up depend on how your organization defines the customer journey, and tracks progress through the funnel.
To set up stages in the funnel, follow these steps:
-
On the Impact Modeler Setup page, click + Add Stage.
A new row is added to the funnel stage configuration table, and the new funnel stage is added to the funnel diagram.
-
By default, newly added stages are named New Stage. To edit the name of a stage, click on its name under the Funnel Stage column. Type the name you want to use into the field, then click anywhere outside of the field to finish editing.
-
Repeat steps 1-2 until you have added and named all of the funnel stages you want to use.
-
To save and apply your changes, click Save.
The page reloads, and your changes to the funnel take effect immediately.
Note
Newly added stages are always added in the second position, directly after the first stage. To change the order of the stages, hold the pointer on a stage, then drag it to the position you want using its ![]() Order handle.
Order handle.
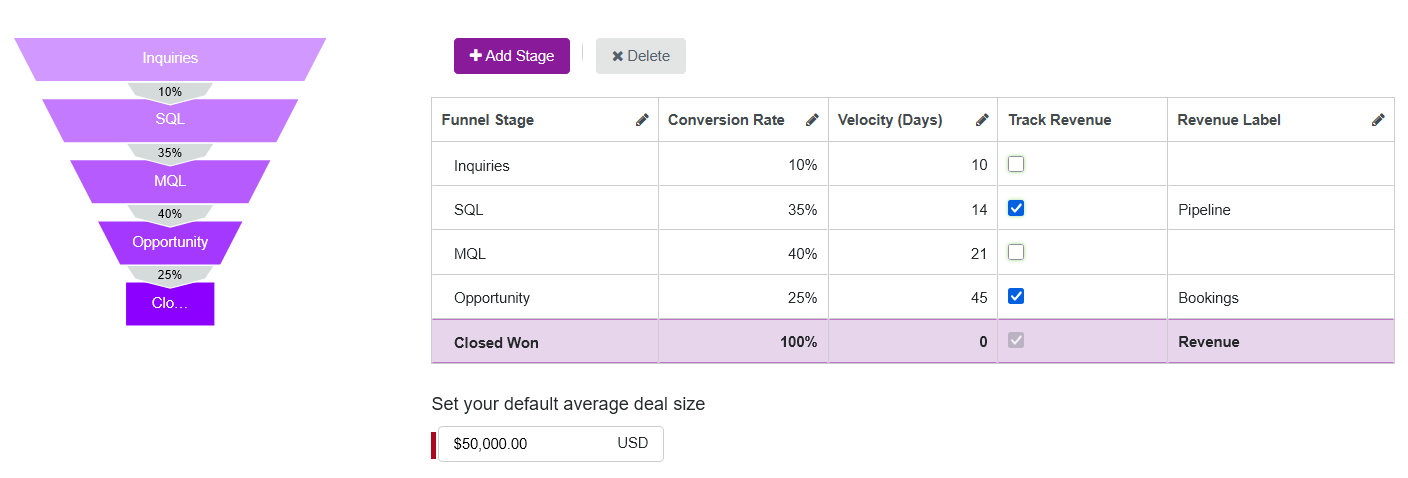
Set Default Performance Metrics
After you have set up the stages of your funnel, the next step is to define the average stage-to-stage performance and deal size that Impact Modeler uses to generate revenue projections. There are three metrics you need to define:
-
Average Conversion Rate: This is the rate at which leads move from one stage to the next on average. For example, if out of 100 unqualified leads you typically generate 25 MQLs, that's a 25% conversion rate between those stages.
-
Average Velocity: This is the average time, in days, that a lead takes to move from one stage to the next.
-
Average Deal Size: This is the average amount of revenue generated when you close a deal and successfully convert an opportunity into a customer.
You specify the average conversion rate and average velocity for each stage. The average deal size only applies to the final stage, so you only set it once.
Note
The default performance metrics you specify here form the basis of the model, and are used as a fallback in cases where a more accurate metric for a given scenario isn't available.
For instructions on how to set up performance metrics for specific scenarios, see the section Set Scenario-Specific Performance Metrics
To set the default performance metrics for Impact Modeler, follow these steps:
-
On the Impact Modeler Setup page, enter the average deal size you want to use for projections in the Set your default average deal size field.
-
The currency of this field is automatically set to the Primary Plan Currency set under Activity Configuration > Activities > Currencies > Currency.
-
-
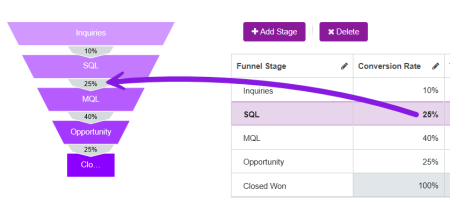
Use the funnel stage configuration table to set the default conversion rates and velocities.
-
Under the Conversion Rate column, click on a row to edit the conversion rate. Enter the conversion rate (as a percentage) from the selected stage to the next stage, then click anywhere outside of the field to finish editing. The new rate you set is immediately reflected in the funnel diagram.
-
Under the Velocity (Days) column, click on a row to edit the velocity. Enter the velocity (in days) from the selected stage to the next stage, then click anywhere outside of the field to finish editing.
-
Repeat for each funnel stage listed in the table (except the final stage, where these metrics are not applicable).
-
-
To save and apply your changes, click Save.

The page reloads, and your changes to the funnel take effect immediately.
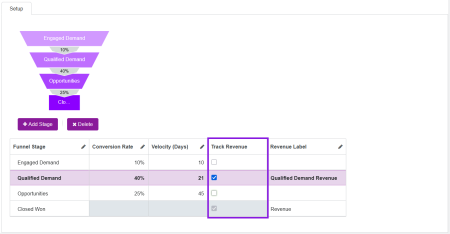
Configure Per-Stage Revenue Tracking
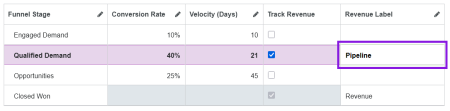
By default, Impact Modeler tracks revenue only at the final stage of the funnel (for closed deals). If you want to see pipeline projections, you can optionally turn on revenue tracking for any other funnel stage. For each stage where revenue tracking is enabled, you can set a custom label for the stage's revenue to reflect the terminology your organization uses for projections at that stage (e.g. "Pipeline" or "Bookings").
When revenue tracking is turned on for a funnel stage, projections are displayed on the Details Panel of all activities where Impact Modeling is enabled, under the Impact section:
-
On the Planned tab, the funnel chart displays a revenue projection for each stage where revenue tracking is enabled, under its custom label (if specified).
-
On the Actual tab displays columns for manually entering stage-specific revenue in the actuals input table, also using the custom label.
To turn on revenue tracking for a funnel stage, follow these steps:
-
On the Impact Modeler Setup page, find the stage for which you want to enable revenue tracking in the table.
-
To enable revenue tracking for a stage, select the checkbox in the Track Revenue column for that stage:
-
Optional: By default, the label for the stage's revenue figure is automatically set to "[Funnel Stage Name] Revenue" in the Revenue Label column. To change this label, click on the field in the Revenue Label column for a stage and type in the label you want to use:
Note
-
You can set a custom Revenue Label for any funnel stage where revenue tracking is enabled, including the final Closed Won stage.
-
It's not possible to remove the label from a stage's Revenue Label field while revenue tracking is enabled for that stage.
-
-
To save and apply your changes, click Save.

The page reloads, and your changes take effect immediately.
If you want to stop tracking revenue for a stage, follow these steps again and deselect the Track Revenue option for that stage, then click Save.
Note
When you turn off revenue tracking for a stage, any custom label set in the Revenue Label column is also removed, and is not restored if you turn Track Revenue back on again for the funnel stage later.
Set Scenario-Specific Performance Metrics
The default performance metrics values are averages across all of your demand generation efforts, so the accuracy of your Impact Modeler projections will be limited if you only use these values. This is particularly the case if you see a lot of variability in conversion rate, velocity, and deal size when you look at different combinations of factors like location, prospect size, product type, etc.
To improve the precision of your Impact Modeler projections, you can define various scenarios, and assign custom performance metrics values to those scenarios. Whenever a given scenario applies, the model uses the more precise custom values to calculate revenue projections, instead of the default average values. For example, if you tend to see slower velocities but higher conversion rates and deal sizes with enterprise prospects, you can set up custom performance metrics values to refine the model's accuracy for this scenario.
In Impact Modeler, you define scenarios based on activity attribute values. For each performance metric, you can select up to three list-type activity attributes (Drop-Down List or Multi-Select List), then define a custom performance metric value for each combination of attribute values.
Examples
Example 1: One Attribute
If your primary scenarios are fairly straightforward, you can create them based on just one attribute.
Example Scenario Attribute: Industry
Example Attribute Values:
-
Healthcare
-
Financial Services
Why: Some industries have regulatory complexity that can significantly reduce velocity. For example, Financial Services and Healthcare can often have longer sales cycles due to regulatory compliance.
Example 2: Two Attributes
You can combine two attributes to create more granular scenarios. This is especially useful for attributes that are strongly correlated in terms of their impact on the funnel.
Example Scenario Attributes: Product + Geography
Example Attribute Value Combinations:
-
Product A + North America
-
Product A + APAC
Why: Budgets and product-market fit can vary regionally. For example, a product might have a higher average deal size in North America, or prospects for that product in APAC might take longer to go from SQL to Opportunity.
Example 3: Three Attributes
If your organizations has a lot of high-quality historical performance data and the ability to analyze it in depth, you can use up to three attributes to capture the most granular scenarios.
Example Scenario Attributes: Product + Geography + Channel
Example Attribute Value Combinations:
-
Product A (SMB) + North America + Paid Search
-
Product B (Enterprise) + North America + Event
Why: You might find that certain key attributes drive very large variances in funnel peformance metrics. For example, digital ads for an SMB-focused product in North America might generate few MQLs from a lot of inquiries, but lead to a short sales cycles for comparatively small deal sizes. By contrast, in-person events like trade shows might drive much higher conversion rates (and larger deal sizes) for an Enterprise-focused product in the same market.
To set scenario-specific performance metrics, follow these steps:
-
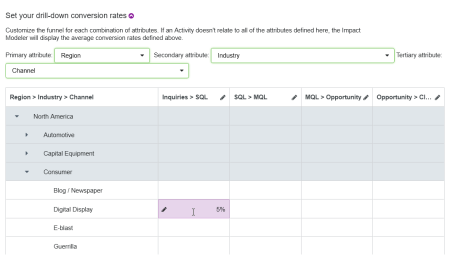
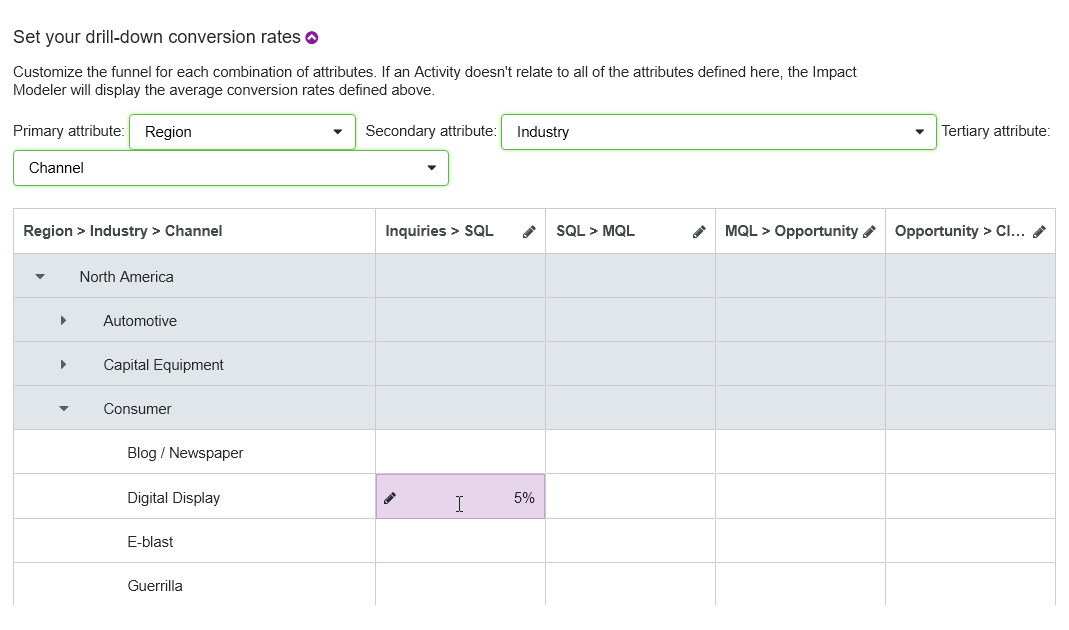
On the Impact Modeler Setup page, click the section Set your drill-down conversion rates to expand it.
-
Use the Primary attribute menu to select the first attribute you want to use to define the scenario for conversion rates.
Tip
You can start typing into the attribute menu field to search for matching attribute names.
A table is displayed that has rows for each of the values in the selected attribute, and columns for each of the transitions between stages in your funnel.
-
Optional: Use the Secondary attribute and Tertiary attribute menus to select additional attributes to define the scenario for conversion rates.
When you select more than one attribute, every combination of values from the selected attribute is added to the table as a row:
Note
The attribute value combinations are grouped and nested in levels, according to the order in which you selected the attributes: the values of the primary attribute are at the highest level, the values of the secondary attribute are at the next level down, and the values of the tertiary attribute are at the lowest level.
-
To set a custom conversion rate for an attribute value (or value combination), find the cell where its row intersects with the column for the stage transition for which you want to set the conversion rate. Click the cell to edit it, type in the conversion rate you want, then click anywhere outside the cell to finish editing.
-
Optional: Repeat step 4 for any other attribute value (or value combination) and stage transition for which you want to set a custom conversion rate.
Important
You do not need to enter a value in every cell of the table: if no custom conversion rate is specified for a stage transition and attribute value pair, Impact Modeler will use the default conversion rate for that stage transition. This also applies to custom velocities and deal sizes.
-
Click on the section Set your drill-down velocities and repeat steps 2-5 to set custom velocities for stage transitions and attribute value pairs.
-
Click on the section Set your drill-down deal sizes and repeat steps 2-5 to set custom deal sizes for stage transitions and attribute value pairs.
-
As the average deal size only applies to the last stage in the funnel, there is only one column you can edit in the table for custom deal sizes.
-
-
To save and apply your changes, click Save.
The page reloads, and your changes take effect immediately. On all activities that have attribute values for which you have specified a custom conversion rate, velocity, or deal size, the custom value is used in the activity's Details Panel > Impact section.
Note
If you select a Multi-Select List attribute with the percentage allocation option turned on to define a scenario, Impact Modeler takes the assigned percentage share for each selected option into account when calculating revenue projections.