Summary View
You see all the information about an activity in the Details panel, and you get a performance overview of the entire plan under > Insights. But to get a simple overview of selected activities, you can use the Summary view. The Summary view allows you to answer the following questions, for example:
-
Did I—or my team—assign planned spend to all relevant activities?
-
Did I—or my team—enter planned results for all relevant activities?
-
What activities are the best or worst performers in terms of revenue generation?
-
Which activities are our biggest investments?
Answering these questions will give you insight into the importance of the various activities and the integrity of the marketing plan.
To meet these requirements, a Summary view has been added. The aim of the Summary view is to summarize the key data points about the activities or a subset of the plans (when filtering or grouping). This allows you to see how the activities compare to each other and how the overall performance of the plan or subset of the plan is.
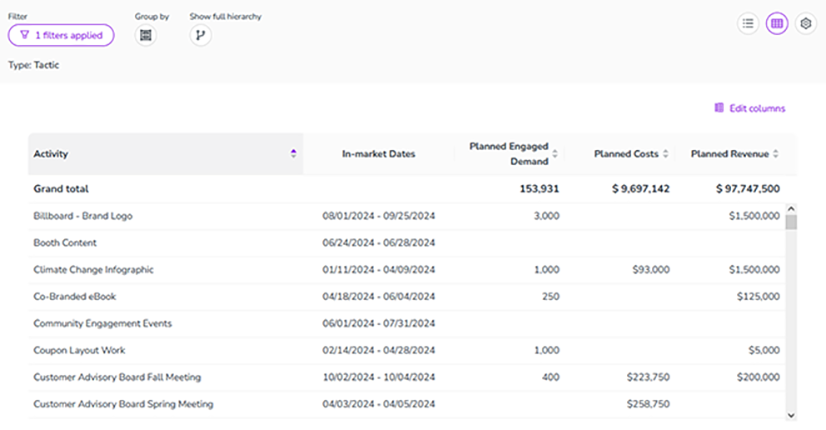
The Summary view currently includes:
-
Activity name
-
In-market Dates
-
Planned Inquiries
-
Planned Costs
-
Planned Revenue
-
Planned ROI
The following data is available in Early Access status, see Actual Data in Summary View :
-
Actual Inquiries
-
Actual Revenue
You can decide which of the data is shown and in which order:
-
In the Summary view, click Edit columns.
-
Activate the data you want to see.
-
Drag and drop the data to your desired order.
-
Click X to close the dialog.
A dialog is displayed on the right.
The Summary view displays the data as you selected and arranged it.
To leave the Summary view, click the Timeline button in the top right corner.