Early Access Track and Compare Actual Performance Metrics for Activities
About This Feature
This Early Access feature in the Activities section of Uptempo (part of the Campaign Management module) allows you to compare your planned Key Performance Indicator (KPI) targets against actual results. When you enter your actual performance data, the system automatically calculates the difference between your planned and achieved targets, enabling you to better measure marketing success across all levels of your campaign structure.
Previously, you could only set target values for your KPIs without a structured way to record and visualize actual results. This limited visibility made it challenging to assess whether your campaigns were meeting expectations or to identify which marketing activities were delivering the best returns on investment.
Access Actual KPIs
To access the Actual KPIs feature, follow these steps:
-
Click any marketing activity in your Timeline or Summary view.
-
Click on the KPIs tab in the activity details.
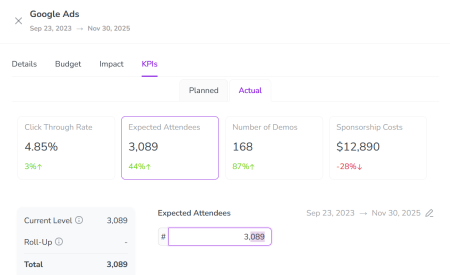
You'll see two tabs at the top: Planned and Actual.
-
Click on the Actual tab to access the performance tracking interface.
Record Performance Results
Once you're in the Actual tab, you can record your performance data in several ways:
-
For total campaign results:
Enter the overall figure in the main value field for each KPI.
-
For monthly tracking:
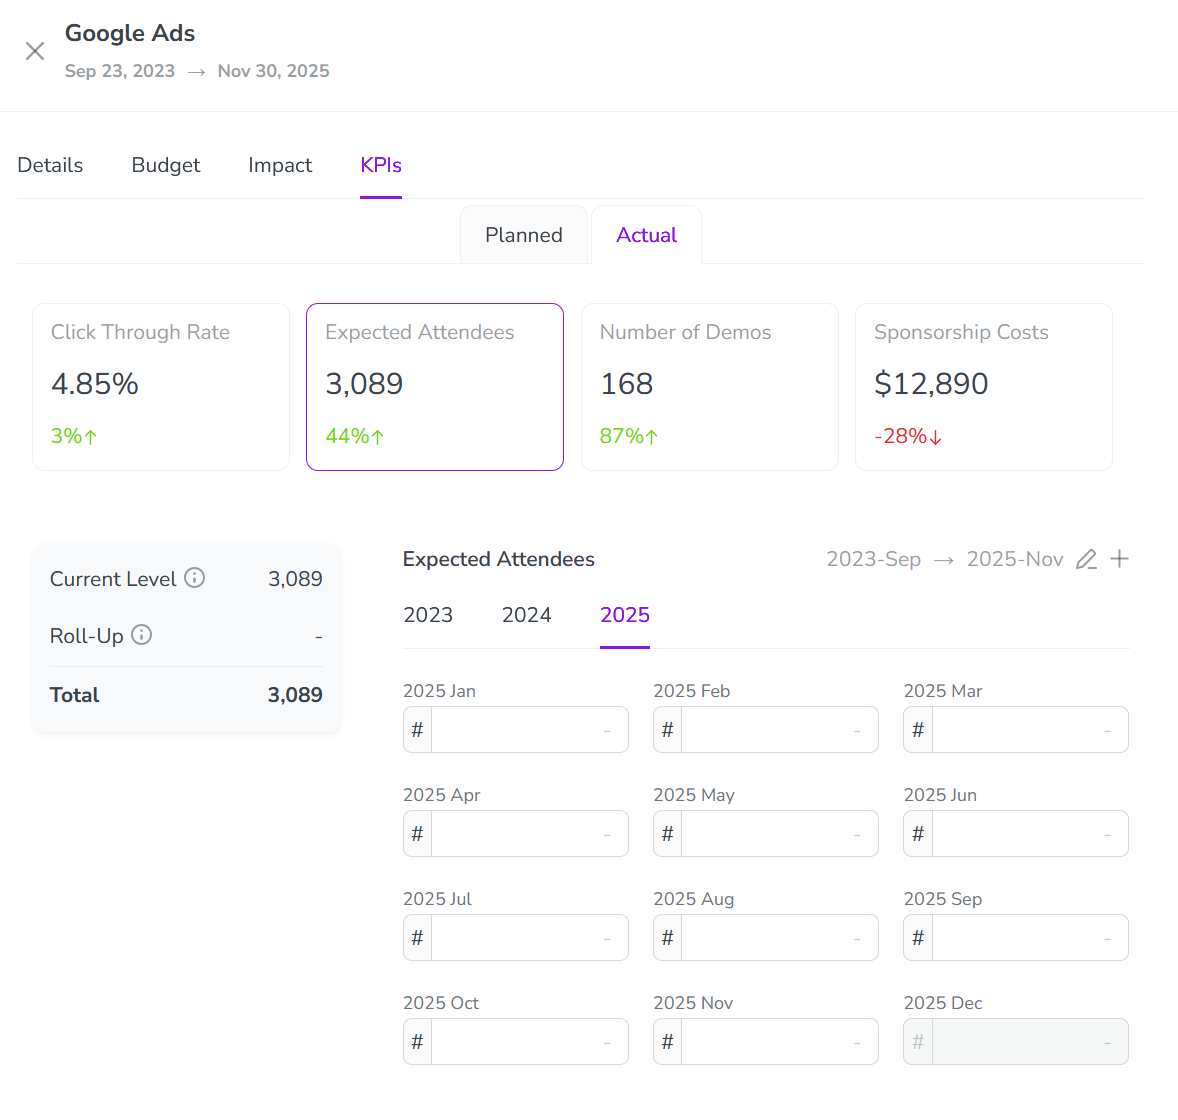
Go to the monthly breakdown section and enter values for specific months — the system automatically calculates the running total.
-
For hierarchical campaigns:
Enter results at the most detailed level, and the system will automatically roll these up to parent campaigns, giving you both individual and aggregated views.
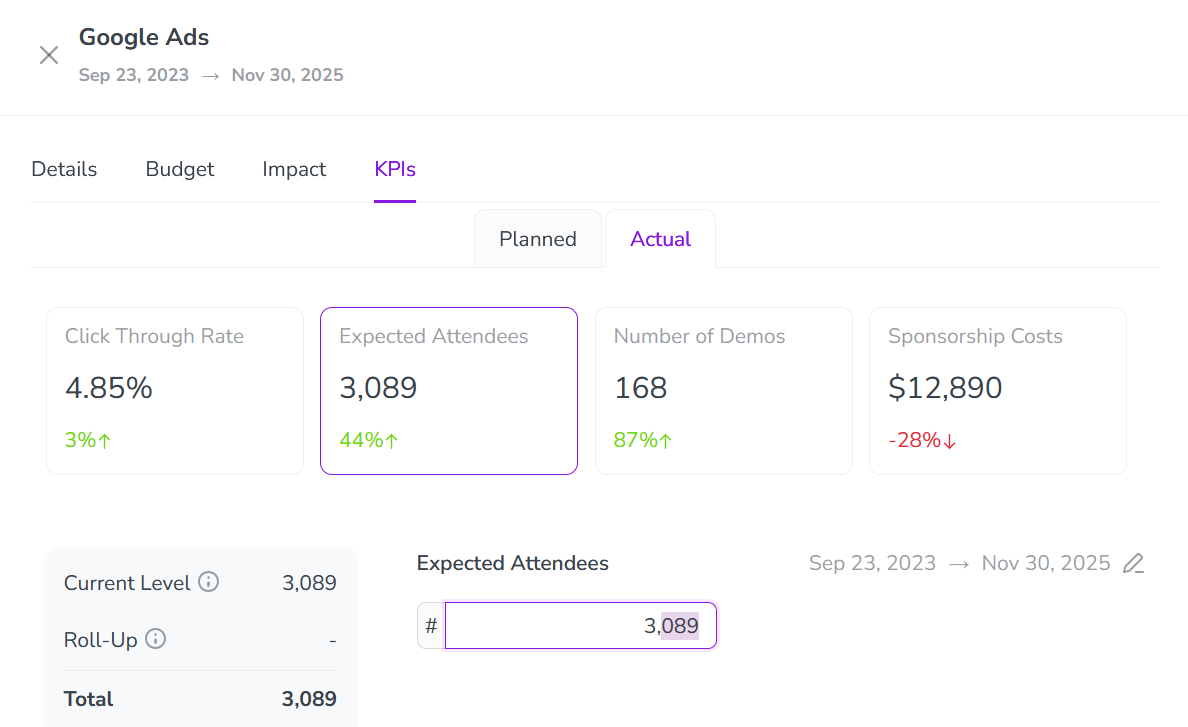
After you enter actual values, the system displays visual indicators of performance: green upward arrows for metrics exceeding targets and red downward arrows for underperforming areas.
Change Time Granularity and Date Range
You can adjust how you track performance over time by setting the time granularity you want to use, i.e. whether you want to record and display values as a single total figure for a selected date range, or break it down by quarter or month.
To change the time granularity and date range, follow these steps:
-
On the Actual tab, click Edit
 by the displayed date range.
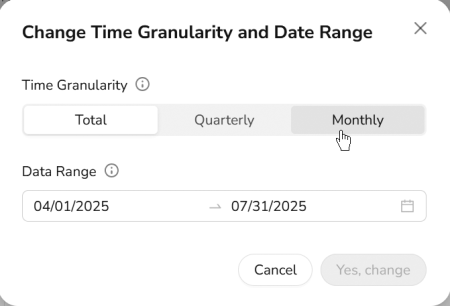
The Change Time Granularity and Date Range dialog opens.
-
In the dialog, select the Time Granularity option you want to use:
-
Total: For viewing the entire campaign period as a single value
-
Monthly: For tracking performance month by month
-
Quarterly: For analyzing quarterly performance trends
-
-
Optional: Use the Date Range field to adjust the date range you want to use.
-
Click Yes, change to save your changes.
The Actual tab updates to show data entry fields that match your selected granularity.

This flexibility lets you analyze performance at the time interval most relevant to your reporting needs, from high-level quarterly reviews to detailed monthly analysis.
Note: Understanding Roll-Up Functionality
One powerful aspect of this feature is how metrics flow through your campaign hierarchy:
When you enter results for lower-level activities, they automatically roll up to parent campaigns. In parent activities, you'll see:
-
Current Level showing direct results for that specific activity
-
Roll-Up showing combined results from all child activities
-
Total displaying the complete performance picture
This hierarchical view helps you understand performance at every level of your marketing structure, from individual tactics to overall strategy.
Configure KPI Settings
To make your performance tracking more meaningful, you can customize two important settings under Activity Configuration > Measures > KPIs:
-
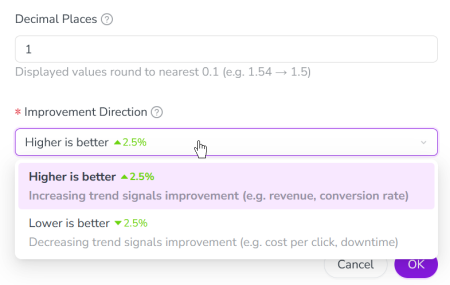
Decimal Places:
-
Choose how many decimal places to display (0 for whole numbers, 1 or 2 for more precision)
This affects how values are rounded in your display (for example, the setting 0 results in 2.4 displayed as 2)
-
-
Improvement Direction:
-
Select Higher is better for metrics like impressions, conversions, or revenue.
-
Select Lower is better for metrics like cost, bounce rate, or response time.
This setting determines how the system visualizes positive/negative performance through colored arrows and percentage indicators
-

Use Cases
Here are some ways you might use this feature in your daily marketing work:
-
Campaign Evaluation: Compare actual impressions against planned values to quickly assess if your campaign is meeting its objectives.
-
Resource Allocation: Identify which activities are delivering the best results and adjust your budget accordingly.
-
Trend Analysis: Track monthly performance patterns for your campaign, noting which months performed best to inform future planning.
-
Performance Reporting: Use the clear visual indicators to quickly build executive reports showing campaign success rates across your marketing portfolio.