User Activity History
This page focuses on insights involving user activities over time. It provides metrics such as number of sessions and logged in users in different time periods as well as an overview of high/low intensity of usage. In addition, it features a detailed list of users and their activities in tabular format, that is suitable for exporting into external tools such as Excel.
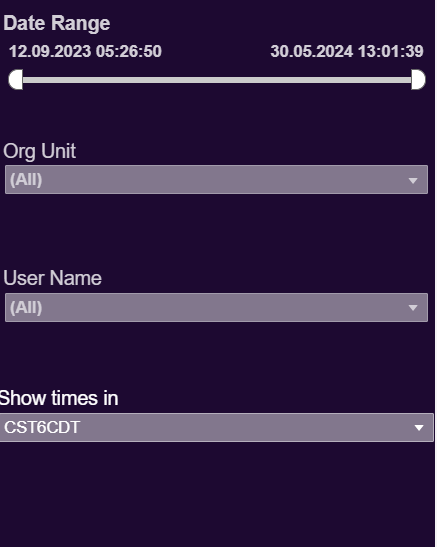
Filters
User Activity History visualizations can be generally filtered by date, organizational unit and users. In addition, the filter section contains a time zone parameter which the allows selection of time zone to display all time entries in. The available time zones are extracted from user configuration in Uptempo platform.
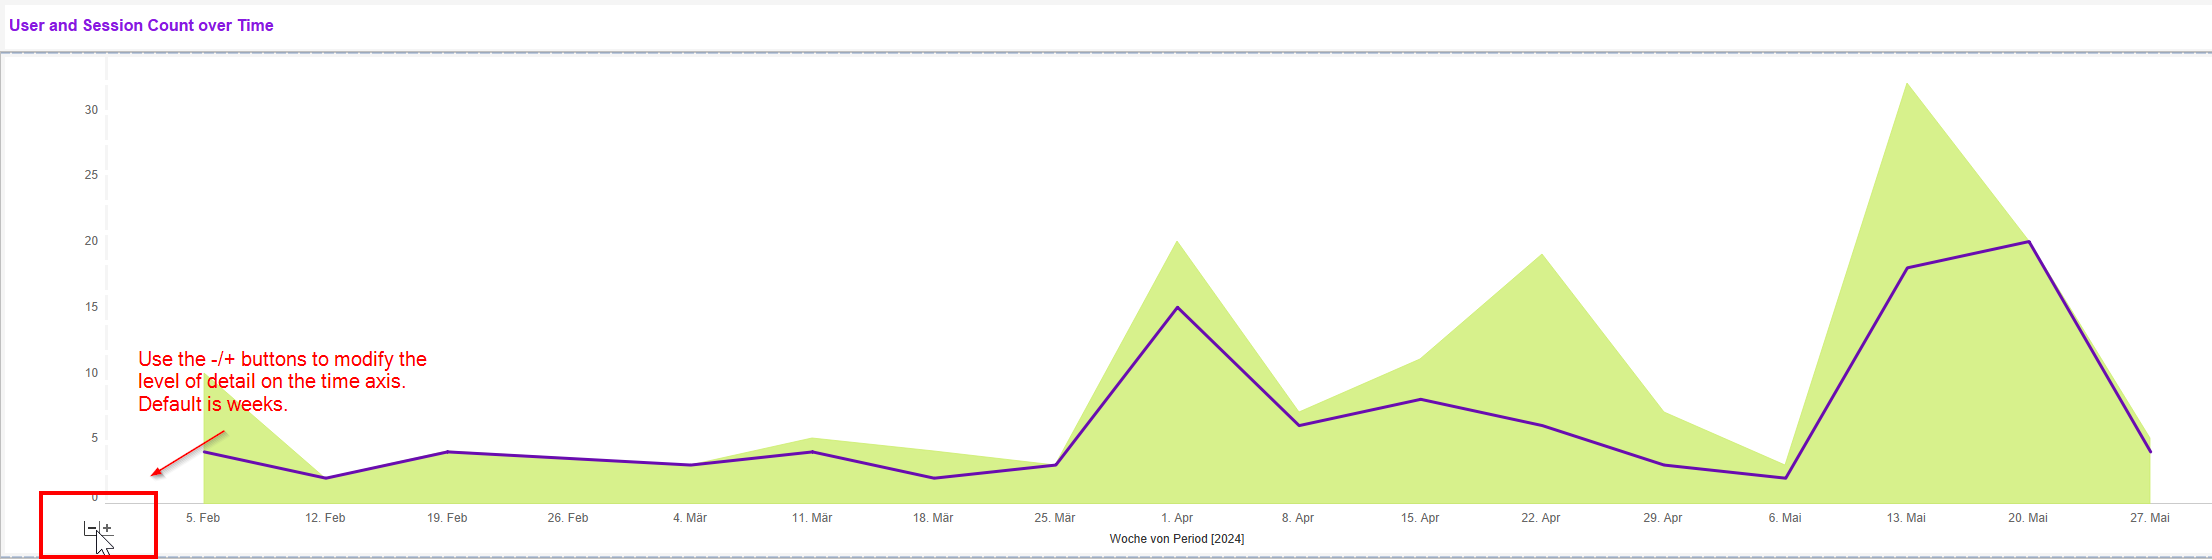
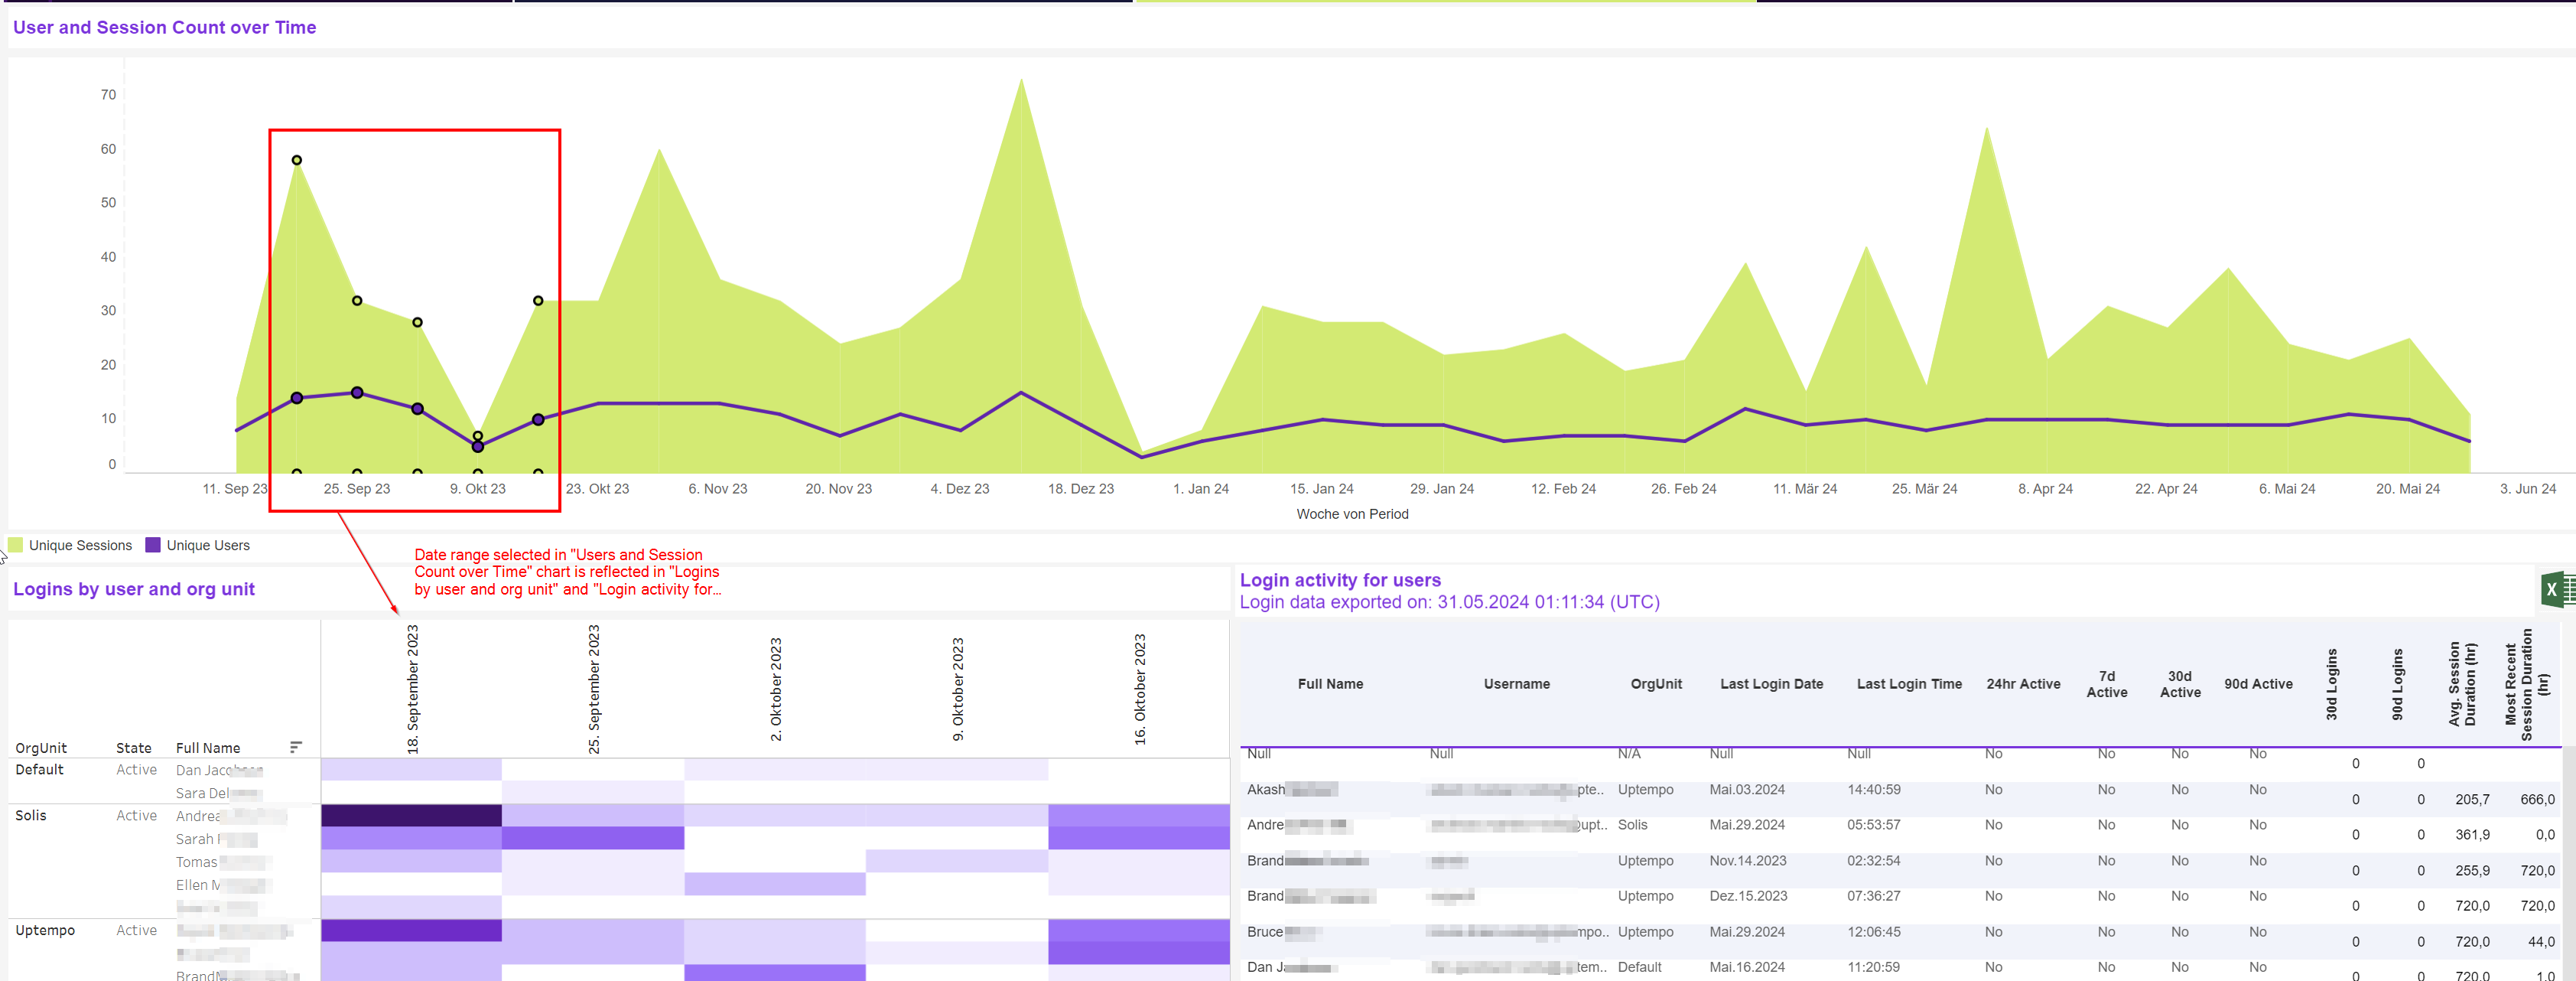
User and Session Count Over Time
This visualization depicts the number of active sessions and number of unique users over time.
Users have the option to drill up/down along the time axis using the +/- buttons in the bottom left corner of the chart. The default setting is Weeks.
Selecting a range of dates will filter the remaining charts in this dashboard accordingly:
To remove the selection, click anywhere in the visualization.
Logins by User and Org Unit
This chart counts the number of logins by users over time. The darker the color, the more often each user has logged in. This calendar view thus provides fast overview of when each individual user was most busy.
users are grouped by their organizational units and their status in the system (active/inactive where active users are enabled while inactive users are disabled).
Similarly to Users and Session Count over Time chart, users have also the option to modify the time axis by drilling down or up using the controls in top left corner. The controls appear on hover over the period axis, the default setting here is as well Weeks.
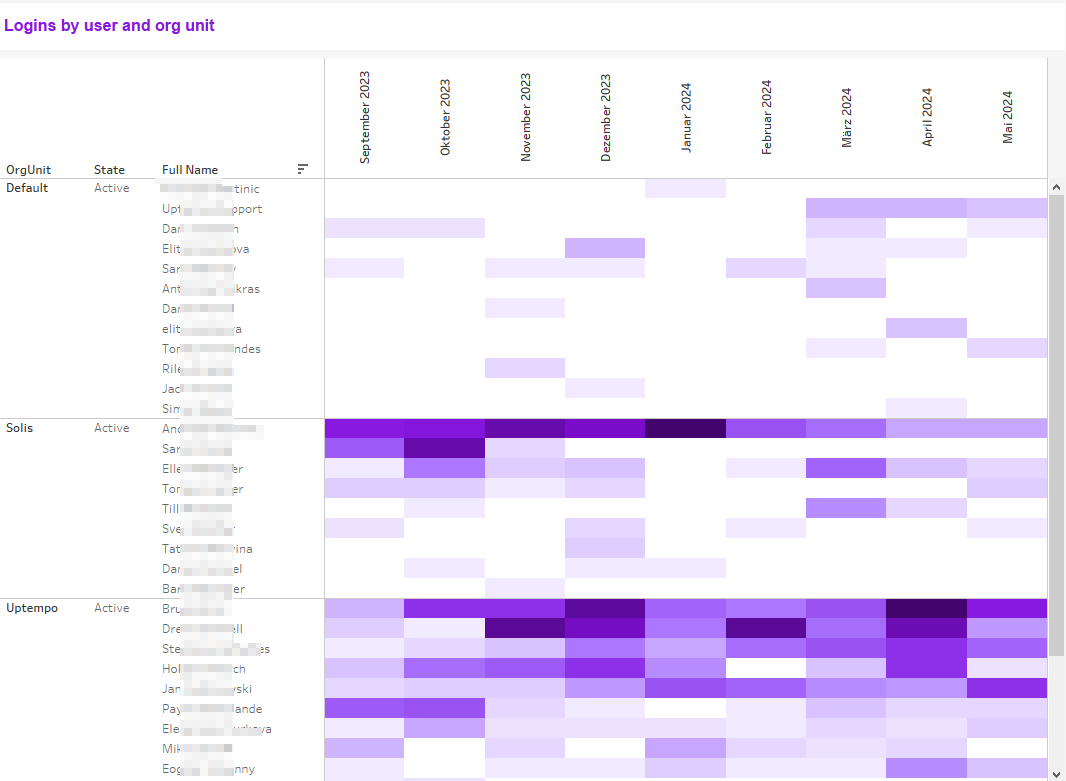
Clicking a data point in this chart will also filter other elements for this dashboard accordingly (i.e. by full name, state, org unit and time period).
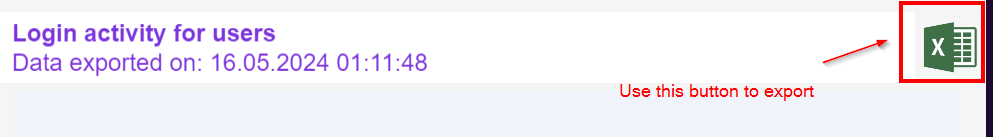
Login activity for users
This table shows the login history on user level. It includes detailed information regarding last login date and time, number of logins in the last 30 and 90 days as well as average session duration along with the latest session duration. Data in this table can be updated on a more frequent schedule than basic user related data. The last date and time of data export is shown in the title (in UTC).
|
Field |
Description |
|---|---|
|
Full Name |
Name of the user |
|
Username |
User login. A user can have more than one logins. |
|
Org Unit |
Organizational unit the user belongs to |
|
Last Login Date |
Date on which user last logged into the server. A user session can spawn more than one day. Last login thus is the date of a session event of type “Login” |
|
Last Login Time |
Time of last login where times are shown in time zone as selected. Dashboard users can change the time zone by selecting one of the time zones in the “Show Times in” selector. |
|
24hr Active |
“Yes”/”No” Flag indicating if the user was logged in and active within the last 24 hours from current time. Activity is e.g. a redirect from one module to another. |
|
7d Active |
“Yes”/”No” Flag indicating if the user has logged in and active within the last 7 days from current time |
|
30d Active |
“Yes”/”No” Flag indicating if the user has logged in and active within the last 30 days from current time |
|
90d Active |
“Yes”/”No” Flag indicating if the user has logged in and active within the last 90 days from current time |
|
30d Logins |
Count of Logins within the last 30 days |
|
90d Logins |
Count of Logins within the last 90 days |
|
Avg. Session Duration (hrs) |
Average duration of a session in hours. Calculated as the number of hours between the first login and the logout if present. In case no logout was recorded, the duration is calculated as time difference in hours between login and current time. |
|
Most recent Session Duration (hrs) |
Duration of latest session. Calculation is analog to average session duration |
This detailed tabular report is particularly useful for exporting into external tools. Dashboard users can export this widget either as CSV or directly into Excel by clicking the Excel icon in top right corner and then selecting Detailed user activity (for export) as workbook.