Display Formats in the Job Overview
The job overview gives you an overview of current jobs. You can monitor the status and progress of these jobs and make adjustments where necessary. Double-click to open a job in the list view.
The jobs can be displayed in a table, a Gantt chart, and a Kanban view. You can switch between the views using the following icons:
-
 Table
Table -
 Gantt chart
 -
 Kanban view
Note
Your organization may have chosen to disable the Gantt and Kanban view options. If you are unsure, please contact your administrator.
The table overview table allows you to view the most important information (such as the name, creator, state, and completion date) at a glance. You can display additional required columns or hide columns that are not required. The table gives you quick access to individual details of the jobs, allowing you to compare them. Double-click on an entry or click on the Edit button to open the selected job and view and edit the data sheet.
If you want to apply an action to multiple jobs, you can select the jobs in the table using the following shortcuts:
-
Click while holding down the CTRL or CMD key: The clicked job is selected.
-
Click while holding down the SHIFT key: The first and last clicked job and all in between will be selected.
For information on how to change the table view, see Customizing the Table View.
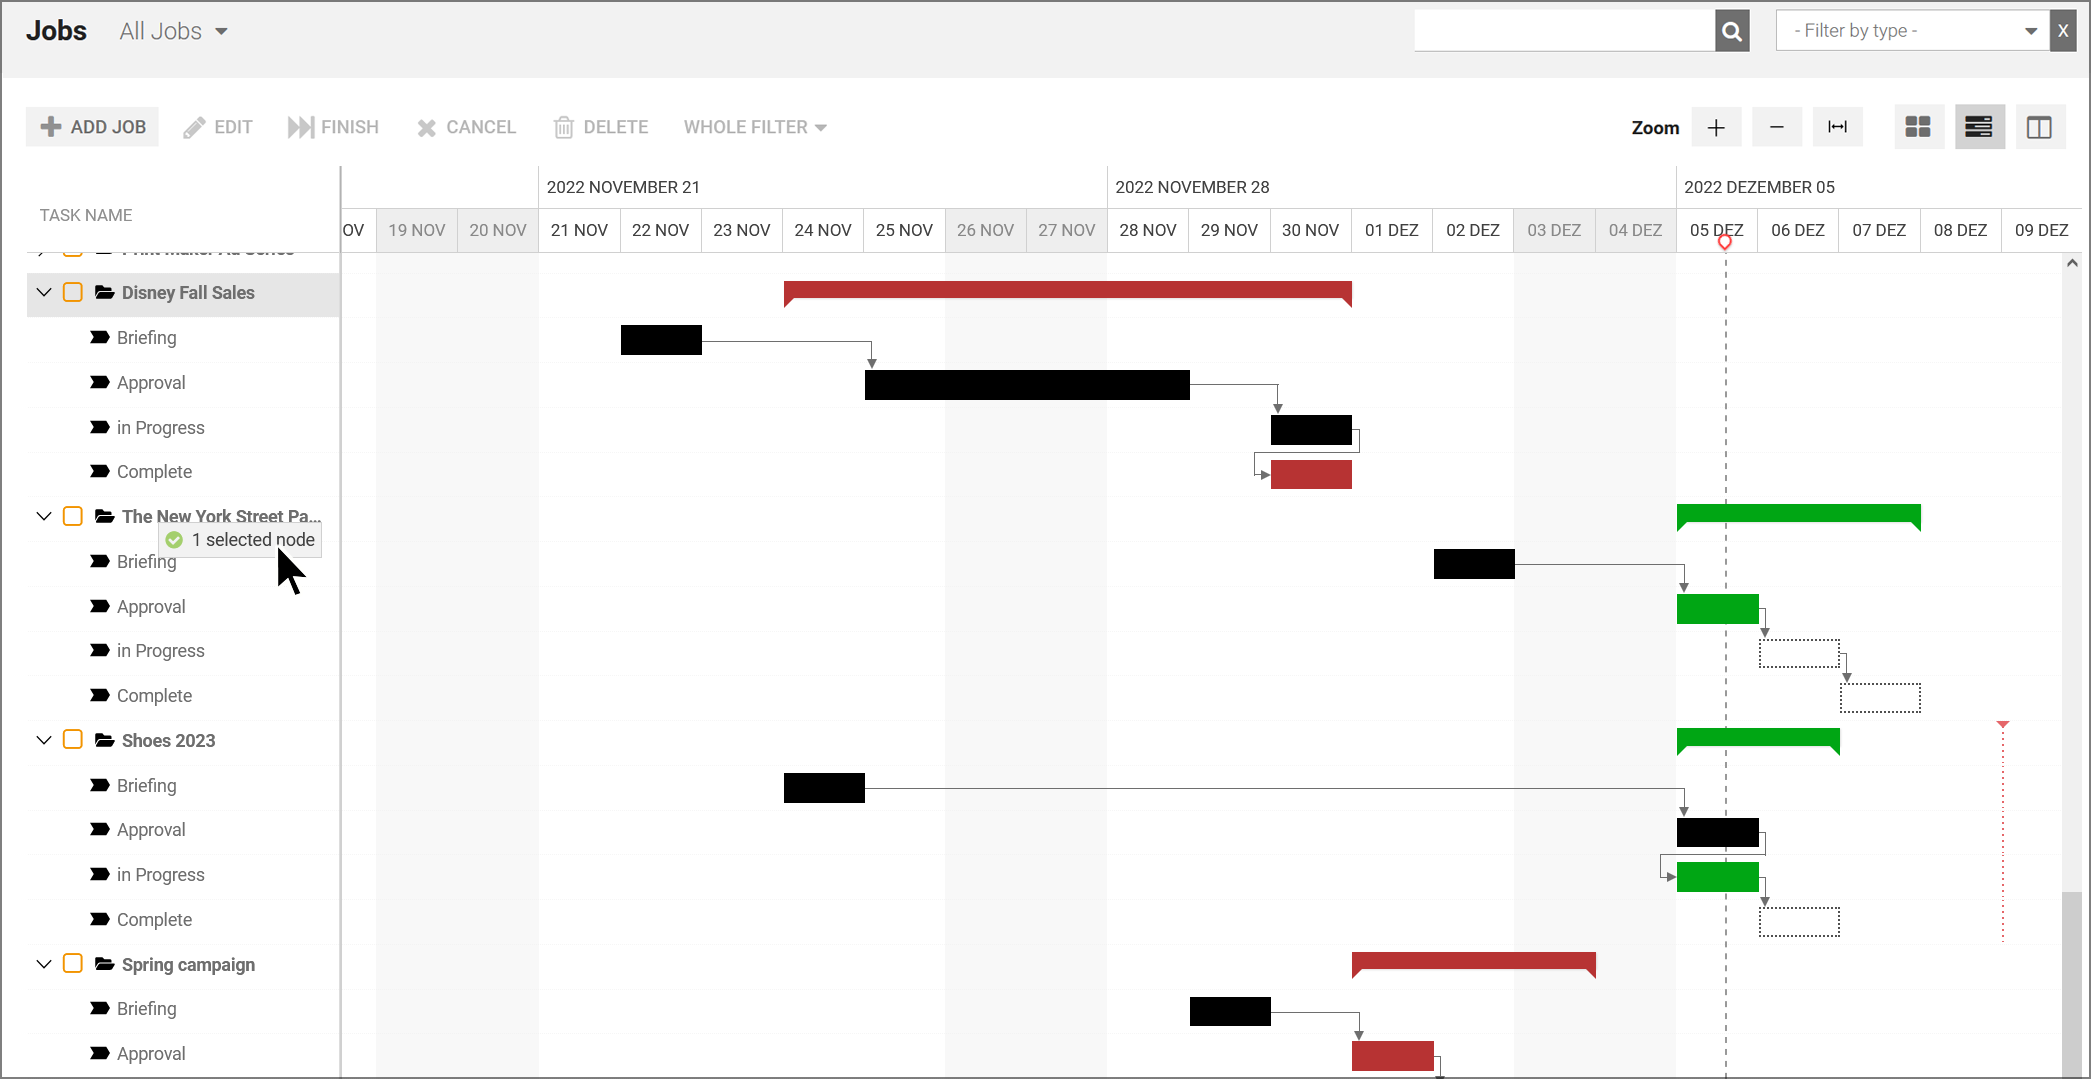
The Gantt view can be used for conventional workflows (linear, non-branching). The Gantt chart allows you to visually analyze the chronological progress and interdependency between workflow steps and tasks. The chart displays the individual workflow steps in the form of bars; for BPMN workflows, an aggregated bar is displayed across all workflow steps. The length of the bars is based on the plan entered on the Workflow tab in the data sheet. If there is no predefined time schedule, an across-the-board rate of one day per workflow step is assumed.
Different colors indicate the current status of the workflow steps:
-
Workflow steps that have not yet been started are displayed in white with a dotted border. Those that have already been completed are solid black.
-
As long as the current workflow step is still on schedule, it is displayed as a green bar.
-
A workflow step is highlighted in red if it is not completed on time.
Note
Unlike the table view and the Kanban view, only active jobs can be displayed in the Gantt chart. It is not possible to display jobs with the status finished, deleted, or canceled.
Your organization may have disabled the button to switch to Gantt mode because complex BPMN workflows do not support this view due to their branching capabilities.
-
For an optimal view, use the zoom elements:
Use the button on the far right to adjust the view to make the best possible use of the overall width.
-
The desired job completion date, if available, is shown using the following marker:

The Kanban view allows you to quickly find out in which workflow step jobs are located. Each workflow step is represented by a column. The jobs can be moved here simply by dragging and dropping them into the next workflow step. Please note that, in the Kanban view, processes are shown but cannot be edited. You can recognize a process by the ⓘ following its name in the header. If you hover the mouse over the ⓘ icon, a tooltip with a detailed explanation will appear.
Note
If you do not see the button to switch to the Kanban view, your organization may have disabled it.
Click on the tile of a workflow step to open the job in the Kanban view for editing.
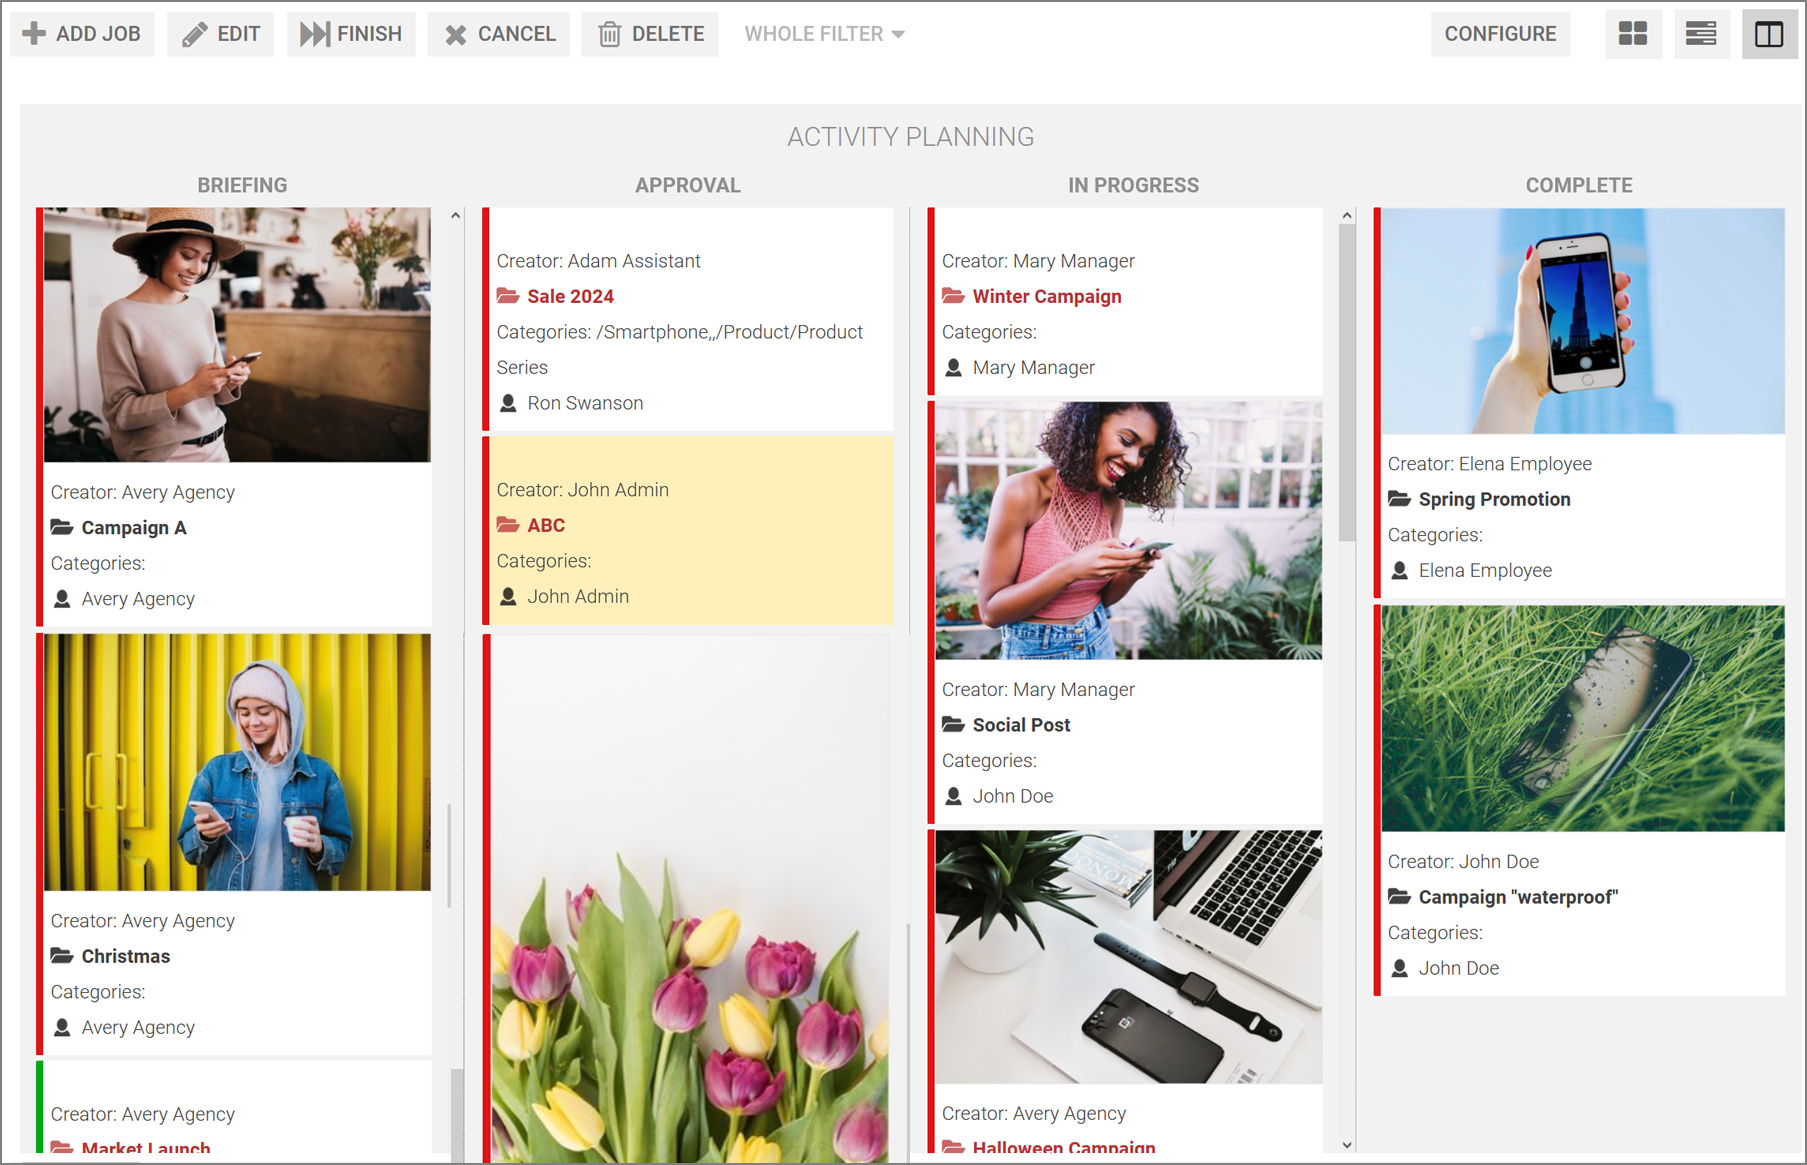
If the current view displays jobs with different workflows, a separate Kanban board is displayed for each workflow and multiple boards are arranged next to one another.
You can configure the information displayed for the jobs.